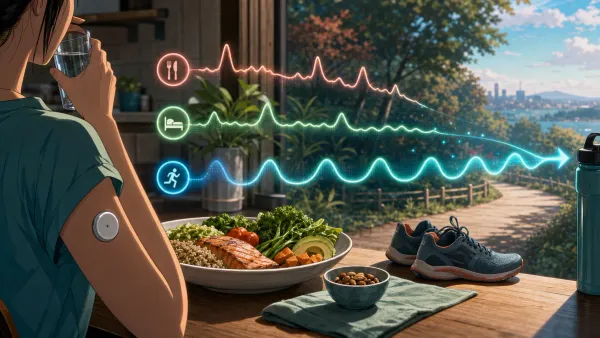
CGM for non-diabetics: what continuous glucose monitoring reveals about aging
Continuous glucose monitors reveal hidden glucose spikes in people without diabetes. Learn what CGM data can and cannot tell you about metabolic aging.
You are not diabetic. Your fasting glucose is normal. Your HbA1c is in range. Yet a continuous glucose monitor (CGM) might reveal that your blood sugar spikes to 180 mg/dL (10 mmol/L) after every pasta dinner — a level that triggers inflammation, oxidative stress, and glycation damage every single time it happens.
If you are trying to decide whether to trust the lab average or the sensor pattern, start with the guide to normal HbA1c with glucose spikes.
The CGMap study, analyzing data from over 7,000 non-diabetic individuals aged 40–70, found that glucose variability — not just average glucose — is associated with unfavorable diet quality, higher ultra-processed food intake, and metabolic dysfunction. A separate study confirmed that even within the “normal” range, higher and prolonged glycemic excursions increase inflammation, endothelial dysfunction, and oxidative stress.
Standard blood tests show you a single frame from a 24-hour movie. CGM shows you the whole film — and what it reveals about aging may change how you eat. For a direct comparison with the other cornerstone marker of metabolic aging, see our article on CGM vs fasting insulin.
What you’ll learn:
- What CGMs measure and why it matters for non-diabetics
- How glucose variability drives aging independently of average glucose
- Optimal glucose ranges for longevity (tighter than clinical “normal”)
- How to use CGM data to personalize your anti-aging diet
Quick answer
A CGM can be useful for people without diabetes when it is used as a short learning tool. It can reveal personal glucose responses to meals, sleep, stress, and exercise that fasting glucose and HbA1c can miss.
CGM data does not prove that every spike causes aging damage, and it is not required for every healthy person. Treat it as a pattern-finding tool, and involve a clinician if readings are repeatedly very high, unexpectedly low, or inconsistent with symptoms.
Key facts
- A CGM measures interstitial glucose every few minutes, so readings can lag behind blood glucose and should be interpreted as trends.
- Studies in people without diabetes show that most glucose values stay in a normal range, but variability differs by age, diet quality, sleep, activity, and metabolic health.
- Over-the-counter CGMs are available in the United States for adults who do not use insulin, including people without diabetes who want diet and exercise feedback.
- The most actionable CGM experiments are food sequencing, post-meal walking, meal timing, sleep improvement, and exercise consistency.
- CGM works best alongside HbA1c, fasting glucose, fasting insulin, triglycerides, HDL, waist circumference, and symptoms rather than as a replacement for clinical testing.
What is continuous glucose monitoring?
A CGM is a small sensor (typically worn on the arm or abdomen) that measures interstitial glucose levels every 1–5 minutes, providing 288+ data points per day. Originally designed for diabetics, CGMs are increasingly used by health-optimizing non-diabetics to understand their metabolic responses to food, exercise, stress, and sleep.
Quick definition: A CGM provides continuous, real-time glucose data that reveals hidden spikes, variability patterns, and metabolic responses invisible to standard blood tests — making it a powerful tool for longevity-focused metabolic optimization.
CGM metrics that matter
| Metric | Definition | Longevity target |
|---|---|---|
| Time in range | % of time glucose is 70–120 mg/dL (3.9–6.7 mmol/L) | >90% |
| Glucose variability (CV) | Coefficient of variation of glucose levels | <20% |
| Post-meal peak | Highest glucose after eating | <140 mg/dL (7.8 mmol/L) |
| Fasting glucose | Morning pre-meal level | 72–85 mg/dL (4.0–4.7 mmol/L) |
| Dawn phenomenon | Early morning glucose rise | Minimal (<100 mg/dL / 5.6 mmol/L) |
How glucose variability accelerates aging
Beyond average glucose
Standard blood tests measure fasting glucose and HbA1c (3-month average). But aging damage from glucose is driven more by peaks and variability than by averages:
1. Glycation and AGEs Every glucose spike above ~140 mg/dL (7.8 mmol/L) accelerates the formation of advanced glycation end-products (AGEs) — irreversible molecular cross-links that stiffen arteries, damage kidneys, and age skin. Glycation is cumulative: each spike adds damage that does not reverse.
2. Oxidative stress Glucose excursions generate reactive oxygen species (ROS) that damage DNA, proteins, and mitochondria. The damage is proportional to the amplitude of the spike — a 180 mg/dL peak causes more oxidative stress than sustained 130 mg/dL, even if the average is the same.
3. Endothelial dysfunction Glucose spikes directly damage the endothelium (blood vessel lining), reducing nitric oxide production and impairing vascular function. This is a precursor to arterial stiffness and cardiovascular aging.
4. Insulin resistance development Repeated glucose spikes drive repeated insulin spikes. Over time, this desensitizes insulin receptors — the pathway to insulin resistance and metabolic aging, even in people who never develop diabetes.
Age-related changes in glucose handling
The CGMap study revealed that glucose handling deteriorates with age even in non-diabetics:
- The percentage of sensor readings within the target range (70–120 mg/dL / 3.9–6.7 mmol/L) decreases with age — from 90% in younger adults to 81% in those over 60
- Older adults show more frequent and higher post-meal spikes
- The dawn phenomenon (morning glucose rise) becomes more pronounced
What CGM reveals that blood tests miss
Hidden glucose patterns
| Pattern | Invisible on blood tests | CGM reveals |
|---|---|---|
| Post-meal spikes | Fasting glucose is normal | 160+ mg/dL after white rice |
| Reactive hypoglycemia | No symptoms at test time | Glucose drops to 55 mg/dL 2h after meals |
| Sleep-disrupted glucose | Not tested at 3 AM | Elevated glucose during poor sleep |
| Exercise response | Tested hours after exercise | Glucose drops 20–40 mg/dL during walking |
| Stress glucose | Not tested during stress | Cortisol drives glucose to 130+ without eating |
| Individual food response | Not food-specific | Same food → different responses in different people |
The most revelatory finding for non-diabetics: identical meals produce dramatically different glucose responses in different people. This is exactly what nutrigenomics predicts — genetic variants like FTO, FADS1/2, and ApoE determine how your body processes carbohydrates and fats, explaining much of the inter-individual variation that CGM data captures. One person’s glucose may spike 60 mg/dL after bread while another’s rises only 20 mg/dL — driven by gut microbiome composition, insulin sensitivity, meal timing, and genetics.
When the same meal looks worse after a late dinner or a bad night, use the late eating vs poor sleep glucose comparison to separate timing from recovery.
6 strategies to optimize glucose for longevity
1. Identify your personal trigger foods
Why it works: CGM reveals which specific foods cause your largest glucose spikes — information that is unique to you and impossible to predict from nutritional labels alone.
How to do it:
- Wear a CGM for 2–4 weeks, eating your normal diet
- Test individual foods: note glucose at baseline, 30 min, 60 min, and 120 min post-meal
- Identify your top 5 spike triggers and your top 5 “flat-line” foods
- Modify or replace trigger foods — or change how you eat them (see strategies below)
Expected results: reduced daily glucose variability within 1 week of personalized adjustments.
2. Apply food sequencing (vegetables first)
Why it works: A 2023 study confirmed that eating vegetables and protein before carbohydrates reduces post-meal glucose spikes by 30–40% — even when total meal composition is identical. The fiber and protein slow gastric emptying, reducing the rate of glucose absorption.
How to do it:
- Start every meal with vegetables or salad (at least 5 minutes before carbs)
- Follow with protein and fat
- Eat carbohydrates last
- Add vinegar (1 tablespoon / 15 mL in water before meals) — shown to reduce post-meal glucose by 20%
Expected results: 30–40% reduction in post-meal glucose peaks; immediately visible on CGM.
3. Walk after meals
Why it works: A 10–15 minute walk after eating activates muscle glucose uptake through GLUT4 transporters — independent of insulin. This directly blunts the post-meal spike. Walking at 2 mph (3.2 km/h) is sufficient.
How to do it:
- Walk for 10–15 minutes within 30 minutes of finishing a meal
- Even slow walking is effective — pace does not matter much
- If walking is not possible, standing or light movement helps
- Focus on the largest meal of the day for maximum impact
Expected results: 20–30% reduction in post-meal glucose peak; reduced glucose variability.
4. Optimize sleep to protect metabolic health
Why it works: A single night of poor sleep reduces insulin sensitivity by up to 25% the next day. CGM data consistently shows that poor sleep nights are followed by higher glucose variability — even with identical food intake.
How to do it:
- Prioritize 7–8 hours of quality sleep
- Optimize deep sleep — the stage most critical for metabolic restoration
- Avoid eating within 3 hours of bedtime (reduces nocturnal glucose elevation)
- Address sleep apnea — it directly impairs glucose regulation
Expected results: improved next-day glucose control; lower fasting morning glucose.
5. Time carbohydrates strategically
Why it works: Carbohydrate tolerance varies throughout the day due to circadian insulin sensitivity patterns. Most people handle carbohydrates best in the morning and early afternoon, with reduced tolerance in the evening.
How to do it:
- Front-load carbohydrates earlier in the day (breakfast and lunch)
- Reduce carbohydrate intake at dinner
- If exercising, consume carbohydrates around workout windows (enhanced muscle uptake)
- Track your personal circadian glucose pattern with CGM
Expected results: reduced evening glucose spikes; improved overnight glucose stability.
6. Build metabolic flexibility through exercise
Why it works: Regular exercise — particularly strength training and high-intensity intervals — increases the number of GLUT4 transporters on muscle cells and improves mitochondrial function. This enhances your body’s ability to clear glucose from the bloodstream without excessive insulin.
How to do it:
- Strength training 2–3x/week (increases muscle glucose sink)
- Zone 2 cardio 150+ min/week (improves mitochondrial fat oxidation)
- HIIT 1–2x/week (enhances GLUT4 expression)
- Track your VO2 max — higher cardiorespiratory fitness = better glucose handling
Expected results: improved glucose response to identical meals within 4–6 weeks of consistent training.
How to track and measure metabolic aging
Key metrics to monitor
| Metric | What it reveals | Target |
|---|---|---|
| CGM time in range | Overall glucose control | >90% in 70–120 mg/dL |
| Fasting insulin | Insulin resistance degree | <5 µIU/mL (optimal) |
| HbA1c | 3-month glucose average | <5.4% (optimal) |
| Triglyceride:HDL ratio | Metabolic health marker | <1.5 (optimal) |
| Biological age | Net metabolic aging effect | Below chronological age |
How SuperAge complements CGM data
CGM shows your glucose. SuperAge shows everything else — and connects the dots.
Metabolic context
SuperAge tracks the factors that influence glucose: exercise, sleep, stress, and recovery. When your CGM shows a high spike, SuperAge helps you identify whether it was the food, the poor sleep, the stress, or the skipped workout.
Biological age integration
SuperAge’s biological age calculation captures the metabolic health signals — resting heart rate, HRV, exercise patterns, body composition — that CGM data alone cannot measure. Together, CGM + SuperAge provide the most comprehensive picture of metabolic aging available.
Frequently asked questions
Is CGM useful for healthy people without diabetes?
Yes — particularly for people over 40 who want to understand their metabolic aging. CGM reveals individual food responses, hidden glucose spikes, and the metabolic impact of sleep, stress, and exercise. Even a 2–4 week CGM trial can provide insights that inform lasting dietary changes.
What glucose level causes aging damage?
Glycation and oxidative stress increase progressively above 100 mg/dL (5.6 mmol/L), with a steeper curve above 140 mg/dL (7.8 mmol/L). For longevity optimization, keeping post-meal peaks below 140 mg/dL and maintaining 70–120 mg/dL at least 90% of the time is a reasonable target.
How does CGM data relate to my biological age blood tests?
CGM captures real-time glucose dynamics, while PhenoAge biomarkers from blood tests capture the cumulative metabolic damage over months. The two approaches are highly complementary: CGM prevents the damage, PhenoAge quantifies how much has already accumulated.
Do I need to wear a CGM forever?
No. Most non-diabetics benefit from 2–4 weeks of CGM data to identify their personal trigger foods, optimal meal timing, and exercise effects. After this learning period, periodic 2-week check-ins (quarterly or semiannually) can track metabolic aging trends without continuous monitoring.
Key takeaways
- Glucose variability matters more than average glucose for aging: spikes drive glycation, oxidative stress, and endothelial damage
- Normal blood tests miss hidden spikes: CGM reveals post-meal peaks, stress glucose, and sleep-disrupted metabolism
- Food sequencing reduces spikes by 30–40%: vegetables first, carbs last
- Post-meal walking blunts glucose peaks by 20–30% — 10 minutes is enough
- 2–4 weeks of CGM provides lasting dietary insight — you do not need continuous wear
See what your blood sugar is really doing
Your fasting glucose and HbA1c are postcards from your metabolism. A CGM is a live video feed. The hidden spikes you discover — and the personalized strategies you develop — may be the most impactful longevity intervention you have ever made.
Ready to track the full picture of metabolic aging? Download SuperAge and start monitoring the exercise, sleep, stress, and biological age markers that work alongside glucose data to reveal your true metabolic health.
For a narrower decision guide, see CGM for non-diabetics: when the data is worth acting on.
References
- Keshet A et al. (2023). “CGMap: Characterizing continuous glucose monitor data in thousands of non-diabetic individuals.” Cell Metabolism. https://pubmed.ncbi.nlm.nih.gov/37080199/
- Bermingham KM et al. (2023). “Glycaemic variability, assessed with continuous glucose monitors, is associated with diet, lifestyle and health in people without diabetes.” Diabetologia. https://pmc.ncbi.nlm.nih.gov/articles/PMC10635370/
- Shah VN et al. (2019). “Continuous glucose monitoring profiles in healthy nondiabetic participants: a multicenter prospective study.” Journal of Clinical Endocrinology & Metabolism. https://pmc.ncbi.nlm.nih.gov/articles/PMC7296129/
- US Food and Drug Administration (2024). “FDA clears first over-the-counter continuous glucose monitor.” https://www.fda.gov/news-events/press-announcements/fda-clears-first-over-counter-continuous-glucose-monitor
- Shukla AP et al. (2015). “Food order has a significant impact on postprandial glucose and insulin levels.” Diabetes Care. https://pubmed.ncbi.nlm.nih.gov/26106234/
- Colberg SR et al. (2009). “Postprandial walking is better for lowering the glycemic effect of dinner than pre-dinner exercise.” Diabetes Care. https://pubmed.ncbi.nlm.nih.gov/19560716/
- Donga E et al. (2010). “A single night of partial sleep deprivation induces insulin resistance in multiple metabolic pathways in healthy subjects.” Journal of Clinical Endocrinology & Metabolism. https://doi.org/10.1210/jc.2009-2430
- Monnier L et al. (2006). “Activation of oxidative stress by acute glucose fluctuations compared with sustained chronic hyperglycemia.” JAMA. https://jamanetwork.com/journals/jama/fullarticle/202670
- Greenfield JR et al. (2025). “A scoping review of glucose spikes in people without diabetes.” Clinical Medicine Insights: Endocrinology and Diabetes. https://pubmed.ncbi.nlm.nih.gov/41170150/
If you are comparing a morning glucose rise with post-meal spikes, use Morning glucose spike vs post-meal spike: which matters more? to decide which pattern deserves more attention.
Last updated: 2026-06-07. This article is regularly reviewed to ensure accuracy.
Related Articles

C-peptide: The true insulin indicator that blood sugar won't tell you
C-peptide reflects your pancreas insulin output. Learn how to read high or low values with glucose, A1c, fasting insulin, and metabolic risk trends.