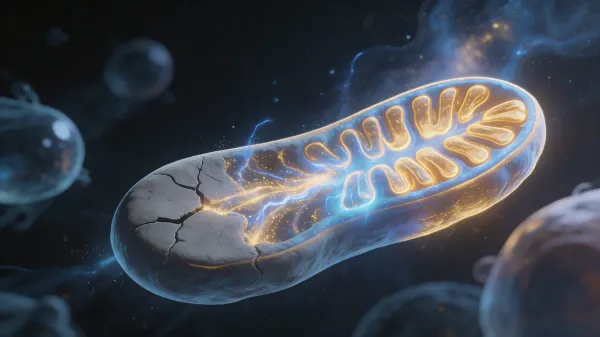
Uric acid: The double-edged sword of aging and longevity
Uric acid is both a powerful antioxidant and a driver of aging. Discover the U-shaped curve, optimal levels for longevity, and how to track your biological age.
What if one of the most misunderstood molecules in your blood could hold the key to both accelerated aging and exceptional longevity? Uric acid — the substance most people associate only with gout — is actually one of the most powerful antioxidants in the human body. Yet when levels climb too high, it fuels inflammation, damages kidneys, and accelerates biological aging.
This paradox makes uric acid unlike any other biomarker. It sits at the exact intersection of protection and destruction, and where your levels fall on this spectrum may reveal more about your biological age than you realize.
By the end of this guide, you’ll understand exactly why uric acid behaves as a double-edged sword, what the science says about optimal ranges for longevity, and how to use this biomarker to take control of your aging trajectory.
What you’ll learn:
- Why humans have unusually high uric acid levels compared to other mammals — and how this relates to lifespan
- The U-shaped mortality curve that makes both high AND low uric acid dangerous
- The specific optimal ranges linked to the lowest all-cause mortality
- How uric acid fits into the KDM biological age algorithm
- 7 evidence-based strategies to keep uric acid in the longevity sweet spot
What is uric acid?
Uric acid is the end product of purine metabolism. When your body breaks down purines — molecules found in every cell and in many foods — the liver converts them into uric acid, which circulates in the blood and is eventually filtered out by the kidneys.
Quick definition: Uric acid is a waste product of purine metabolism that doubles as one of the body’s most potent antioxidants, contributing up to 60% of plasma antioxidant capacity.
Most mammals produce an enzyme called uricase that breaks uric acid down further into allantoin, a more easily excreted compound. But humans — along with great apes and a handful of other species — lost the functional uricase gene roughly 15 million years ago through a series of mutations.
The result? Human serum uric acid levels are 3-10 times higher than those of most other mammals. This wasn’t an evolutionary accident. Higher uric acid levels correlate with longer lifespans across mammalian species, suggesting that our elevated uric acid may have been positively selected for its antioxidant and neuroprotective benefits.
Why uric acid matters for your health
Uric acid is far more than a gout marker. It plays active roles in:
- Antioxidant defense: Scavenges peroxynitrite, hydroxyl radicals, and singlet oxygen — protecting cells from oxidative damage
- Neuroprotection: Shields neurons from ischemic injury and may reduce the risk of neurodegenerative diseases like Parkinson’s and Alzheimer’s
- Immune modulation: Acts as a danger signal that activates the innate immune system when released from damaged cells
- Metabolic signaling: Influences insulin sensitivity, blood pressure regulation, and kidney function
But here’s where it gets complicated. When uric acid levels exceed the saturation point (approximately 6.8 mg/dL at body temperature), it can crystallize into monosodium urate crystals. These crystals trigger intense inflammatory responses, damage joint tissue, and deposit in kidneys — the painful reality of gout and uric acid nephropathy.
The science behind uric acid and aging
The U-shaped mortality curve
The relationship between uric acid and mortality is not linear — it’s U-shaped. Both very low and very high levels are associated with increased risk of death from all causes.
A landmark study from the University of Limerick analyzing over 15,000 patients found that extreme uric acid levels — both high and low — significantly reduced survival rates. The pattern held across cardiovascular disease, kidney disease, and all-cause mortality.
Why low uric acid is dangerous:
- Reduced antioxidant protection against oxidative stress
- Associated with higher rates of Alzheimer’s disease, Parkinson’s disease, and ALS
- Linked to increased susceptibility to oxidative damage in neurons
- Correlated with muscle wasting and frailty in older adults
Why high uric acid is dangerous:
- Triggers chronic low-grade inflammation through crystal formation and NLRP3 inflammasome activation
- Promotes endothelial dysfunction and arterial stiffness
- Damages kidney tubules and reduces filtration capacity
- Activates the renin-angiotensin system, raising blood pressure
- Associated with metabolic syndrome, insulin resistance, and type 2 diabetes
Uric acid and biological aging: the NHANES evidence
A 2025 study published in Frontiers in Nutrition analyzed data from both the NHANES (National Health and Nutrition Examination Survey) and CHARLS (China Health and Retirement Longitudinal Study) cohorts to investigate uric acid’s impact on biological aging.
The findings were striking: elevated serum uric acid was independently associated with accelerated biological aging as measured by validated algorithms including PhenoAge and Klemera-Doubal method (KDM). In NHANES, each 1 mg/dL higher serum uric acid corresponded to about 0.52 years higher KDM biological-age acceleration, and the mortality signal was U-shaped rather than simply “lower is always better.”
Another 2025 study published in Scientific Reports found that the uric acid to HDL cholesterol ratio (UHR) was a particularly strong predictor of biological age acceleration — combining the inflammatory effects of uric acid with the protective deficiency of HDL cholesterol into a single, powerful metric.
A 2026 study in the International Journal of Surgery used UK Biobank data to demonstrate that biological aging acceleration was associated with an average 8.1 µmol/L higher serum uric acid, a 40% increased odds of developing hyperuricemia, and a 39% increased odds of gout — directly linking biological aging to uric acid dysregulation.
A 2026 prospective cohort study of 924 centenarians (median age 102 years) published in Frontiers in Nutrition examined the uric acid-to-albumin ratio (UAR) as a novel composite biomarker integrating metabolic, inflammatory, and nutritional status. Over a median follow-up of 29.7 months, centenarians in the highest UAR quartile had a 28.7% greater risk of all-cause mortality (HR 1.287, 95% CI 1.093–1.516) and a shorter median survival (26 vs 32 months) compared with the lower three quartiles — suggesting that this ratio may be more informative than uric acid alone in the oldest-old population.
A November 2025 systematic review and dose-response meta-analysis published in PLoS One, pooling 39 prospective studies with over 1 million participants, quantified the cardiovascular risk signal linked to elevated uric acid. Hyperuricemia was associated with a 21% higher risk of coronary heart disease (HR 1.21, 95% CI 1.14–1.28) and a 75% higher risk of cardiovascular death (HR 1.75). For every 1 mg/dL increase in serum uric acid, the risks rose by 16% for CHD, 13% for CHD death, 11% for CVD death, and 7% for myocardial infarction. The authors rated the certainty as low for CHD and very low for other cardiovascular outcomes, so this is best read as a consistent risk marker — not proof that lowering uric acid by itself prevents heart attacks.
How uric acid fits into the KDM algorithm
The Klemera-Doubal method (KDM) is one of the most validated biological age algorithms in aging research. It uses a panel of blood biomarkers to estimate how fast your body is aging compared to your chronological age.
Uric acid is one of the core biomarkers in the KDM formula, with a regression coefficient of 0.024 — meaning higher uric acid pushes your calculated biological age upward. The population reference mean used in the algorithm is 4.2 mg/dL, with a standard deviation of 1.45 mg/dL.
In practical terms: if your uric acid is significantly above 4.2 mg/dL, it contributes to a higher KDM biological age. If it’s near or moderately below this reference, it has a neutral or slightly favorable effect on your biological age calculation.
The other KDM biomarkers — including albumin, creatinine, C-reactive protein, HbA1c, total cholesterol, and white blood cells — interact with uric acid in complex ways, making the full panel essential for an accurate biological age estimate.
Optimal uric acid levels for longevity
Based on the convergence of multiple large-scale studies, here are the ranges associated with the lowest all-cause mortality:
| Group | Optimal Range | Unit | Notes |
|---|---|---|---|
| Men (middle-aged) | 5.0–7.0 | mg/dL (297–416 µmol/L) | U-shaped curve; lowest mortality in this range |
| Women (middle-aged) | 4.0–6.0 | mg/dL (238–357 µmol/L) | J-shaped curve; risk rises mainly above 6.0 |
| Older adults (70+) | 4.0–5.0 | mg/dL (238–297 µmol/L) | Narrower sweet spot; frailty risk increases at extremes |
| Centenarians | 3.5–5.0 | mg/dL (208–297 µmol/L) | Tend to have lower levels than age-matched controls |
The centenarian pattern
Research on centenarians consistently reveals a fascinating pattern: people who live past 100 tend to have lower — but not extremely low — levels of uric acid, along with lower glucose, lower creatinine, and better kidney function overall.
This doesn’t mean you should aim for the lowest possible uric acid level. The data is clear: the sweet spot exists in a moderate range where uric acid provides its antioxidant benefits without triggering inflammatory damage.
Sex differences matter
The uric acid curve differs meaningfully between men and women:
- Men show a classic U-shape: both below 4 mg/dL and above 8 mg/dL carry increased mortality risk
- Women show more of a J-shape: risk rises primarily at the high end (above 6 mg/dL), with less penalty for lower levels
- Post-menopausal women see uric acid levels rise due to decreased estrogen (which normally promotes renal uric acid excretion), making monitoring more important after menopause
7 proven ways to optimize uric acid for longevity
1. Prioritize hydration — the simplest intervention
Why it works: Adequate water intake increases renal clearance of uric acid. Dehydration concentrates uric acid in the blood and increases the risk of crystal formation and kidney stones.
How to do it:
- Aim for at least 8-10 glasses (2-2.5 liters / 68-85 oz) of water daily
- Increase intake during exercise, hot weather, or illness
- Monitor urine color — pale yellow indicates adequate hydration
Expected results: Studies show proper hydration can reduce serum uric acid by 0.5-1.0 mg/dL within weeks.
2. Adopt a Mediterranean-style dietary pattern
Why it works: The Mediterranean diet is rich in anti-inflammatory compounds, moderate in purines, and emphasizes plant-based proteins over red meat. Research links this pattern to lower uric acid levels and reduced biological age.
How to do it:
- Emphasize vegetables, fruits, whole grains, legumes, nuts, and olive oil
- Choose fish over red meat (though limit high-purine fish like sardines and anchovies)
- Include cherries and berries — tart cherries have been shown to lower uric acid by inhibiting xanthine oxidase
- Moderate dairy consumption (low-fat dairy is associated with lower uric acid)
Expected results: Adherence to a Mediterranean pattern can reduce uric acid by 0.5-1.5 mg/dL over 3-6 months.
3. Limit fructose and alcohol — the two biggest dietary drivers
Why it works: Fructose is the only sugar that directly increases uric acid production by depleting ATP and accelerating purine degradation. Alcohol (especially beer) both increases purine production and reduces renal uric acid excretion.
How to do it:
- Eliminate or dramatically reduce sugary beverages and foods with high-fructose corn syrup
- Limit alcohol consumption — beer is the worst offender, wine has the least impact
- Read labels: fructose hides in processed foods, condiments, and “healthy” fruit juices
- Limit fruit juice; whole fruits are fine in moderation (the fiber slows fructose absorption)
Expected results: Cutting sugary drinks alone can reduce uric acid by 0.5-1.0 mg/dL within 4 weeks.
4. Maintain a healthy body composition
Why it works: Visceral fat produces inflammatory cytokines that increase uric acid production while simultaneously reducing kidney excretion. Insulin resistance — which tracks closely with visceral fat — directly impairs renal uric acid clearance.
How to do it:
- Focus on gradual, sustainable fat loss if overweight (crash diets can paradoxically spike uric acid)
- Prioritize resistance training to maintain lean mass
- Monitor your triglyceride-to-HDL ratio as a proxy for metabolic health
- Track fasting insulin — insulin resistance is a key driver of hyperuricemia
Expected results: Losing 5-10% of body weight can reduce uric acid by 1.0-2.0 mg/dL.
5. Exercise regularly — but smartly
Why it works: Regular aerobic exercise improves insulin sensitivity, reduces visceral fat, and enhances renal function — all of which help normalize uric acid. However, intense exercise temporarily spikes uric acid through purine breakdown from ATP consumption.
How to do it:
- Aim for 150-300 minutes per week of moderate aerobic activity (walking at 3 mph / 4.8 km/h, cycling, swimming)
- Include 2-3 resistance training sessions per week
- Avoid extreme endurance efforts without proper conditioning
- Stay well hydrated during and after exercise to prevent transient uric acid spikes
Expected results: Regular exercisers show uric acid levels 0.5-1.0 mg/dL lower than sedentary individuals.
6. Protect your kidneys
Why it works: The kidneys excrete approximately 70% of daily uric acid. Any decline in kidney function directly raises serum uric acid levels. Conversely, chronic hyperuricemia damages the kidneys, creating a vicious cycle.
How to do it:
- Monitor creatinine and BUN/urea levels regularly
- Avoid excessive use of NSAIDs (ibuprofen, naproxen) which can impair kidney function
- Manage blood pressure — hypertension is a major driver of kidney damage
- Stay hydrated (yes, this point is worth repeating)
Expected results: Maintaining healthy kidney function keeps the primary excretion pathway working efficiently, preventing uric acid accumulation.
7. Address chronic inflammation
Why it works: Uric acid and inflammation form a bidirectional feedback loop. High uric acid activates the NLRP3 inflammasome, driving hs-CRP and pro-inflammatory cytokines upward. Chronic inflammation, in turn, impairs kidney function and further elevates uric acid.
How to do it:
- Monitor your NLR ratio and hs-CRP as markers of systemic inflammation
- Increase omega-3 fatty acid intake (fatty fish, flaxseed, walnuts)
- Prioritize sleep quality — poor sleep drives inflammation
- Manage chronic stress, which elevates cortisol and promotes inflammatory cascades
Expected results: Reducing systemic inflammation can lower uric acid by 0.3-0.8 mg/dL and break the inflammation-uric acid cycle.
How to track and measure uric acid
Standard blood test
Uric acid is measured through a simple serum blood test, typically included in a comprehensive metabolic panel or ordered separately. Fasting is generally not required, but results can vary with time of day, hydration status, recent alcohol or fructose intake, intense exercise, illness, crash dieting, and kidney function. If a result is surprising, repeat it under similar conditions before treating one number as a trend.
Key metrics to monitor alongside uric acid
| Metric | Optimal Range | Why It Matters |
|---|---|---|
| Uric acid | 4.0–6.0 mg/dL (238–357 µmol/L) | Primary marker — the longevity sweet spot |
| eGFR | >90 mL/min/1.73m² | Kidney filtration capacity — affects uric acid clearance |
| Creatinine | 0.7–1.2 mg/dL (men), 0.5–1.0 mg/dL (women) | Kidney function indicator |
| hs-CRP | <1.0 mg/L | Systemic inflammation — amplified by high uric acid |
| Triglyceride/HDL ratio | <2.0 | Metabolic health proxy — insulin resistance drives uric acid up |
| Fasting insulin | 2–6 µIU/mL | Insulin resistance directly impairs renal uric acid excretion |
| HbA1c | <5.4% | Glycemic control — hyperglycemia and hyperuricemia share metabolic roots |
Testing frequency
- Baseline: Get uric acid measured as part of your annual blood panel
- If borderline (6.0–7.0 mg/dL in men, 5.0–6.0 mg/dL in women): Retest every 6 months
- If elevated (>7.0 mg/dL) or low (<3.0 mg/dL): Work with your healthcare provider for regular monitoring and intervention
How SuperAge helps you track uric acid and biological age
Understanding where your uric acid falls on the longevity curve is only half the equation. The real power comes from seeing how it interacts with your other biomarkers to determine your biological age — and tracking how your interventions shift the needle over time.
KDM biological age calculation
SuperAge integrates the Klemera-Doubal method directly into the app. When you input your uric acid level alongside the other KDM biomarkers (albumin, alkaline phosphatase, BUN, creatinine, CRP, HbA1c, systolic blood pressure, total cholesterol, and white blood cells), the app calculates your biological age and shows you exactly how each biomarker contributes.
Personalized insights
The app doesn’t just give you a number — it highlights which biomarkers are pulling your biological age up and which are pulling it down. If your uric acid is above the optimal range, SuperAge flags it and shows how much it’s contributing to your biological age acceleration.
Progress tracking over time
As you implement the dietary, exercise, and lifestyle strategies outlined above, SuperAge lets you track your uric acid and biological age over time — turning abstract numbers into a clear trajectory of improvement.
Frequently asked questions
Is uric acid actually an antioxidant?
Yes. Uric acid is one of the most abundant antioxidants in human blood, contributing approximately 60% of plasma antioxidant capacity. It scavenges free radicals including peroxynitrite, hydroxyl radicals, and singlet oxygen. This is likely why humans evolved to maintain higher uric acid levels than most mammals — it provides significant protection against oxidative damage, particularly in the brain.
What causes high uric acid besides diet?
While purine-rich foods and fructose are major contributors, several other factors drive uric acid up: genetic variants affecting renal uric acid transport (responsible for up to 60% of variation), kidney dysfunction reducing excretion, insulin resistance impairing renal clearance, certain medications (thiazide diuretics, low-dose aspirin, cyclosporine), dehydration, rapid weight loss or fasting (which increases purine breakdown), and conditions like psoriasis or hemolytic anemias that increase cell turnover.
Can uric acid predict gout risk?
Elevated uric acid is the strongest risk factor for gout, but the relationship isn’t straightforward. Most people with hyperuricemia (uric acid above 7.0 mg/dL) never develop gout — only about 22% of those with sustained levels above 9.0 mg/dL will experience a gout attack within 5 years. Genetics, local tissue factors, and the speed of uric acid elevation all influence whether crystals actually form and trigger symptoms.
Does lowering uric acid slow biological aging?
The evidence suggests that keeping uric acid in the optimal range — not too high, not too low — is associated with slower biological aging as measured by algorithms like PhenoAge and KDM. Aggressive uric acid lowering below the optimal floor may actually be counterproductive, as it removes the antioxidant protection that moderate levels provide. The goal is balance, not minimization.
Should I take medication to lower uric acid for longevity?
Urate-lowering therapy (allopurinol, febuxostat) is well-established for gout management, but using these medications purely for longevity purposes lacks sufficient evidence. The 2020 American College of Rheumatology gout guideline recommends urate-lowering therapy for clear gout indications such as tophi, radiographic damage, or frequent flares, and recommends against starting it for asymptomatic hyperuricemia alone. Some observational studies suggest potential cardiovascular benefits of allopurinol, but randomized controlled trials have been mixed. A 2025 meta-analysis of 51 randomized trials (over 54,000 patients) also found that SGLT2 inhibitors — drugs originally developed for type 2 diabetes — reduce serum uric acid by roughly 0.5–0.9 mg/dL as a side effect, with empagliflozin showing the strongest effect. However, this reduction did not translate into a lower incidence of gout in the trials, so SGLT2 inhibitors should not be prescribed solely for hyperuricemia. If your uric acid is elevated without gout, lifestyle modifications and a clinician review of kidney function, medications, alcohol, fructose intake, and metabolic risk should come before any drug decision.
Key takeaways
- Uric acid is a paradox: It’s both a powerful antioxidant (contributing 60% of plasma antioxidant capacity) and an inflammatory driver when levels get too high
- The U-shaped curve matters: Both very low (<3.5 mg/dL) and very high (>7.0 mg/dL) uric acid levels are associated with increased mortality — the sweet spot is in the middle
- Optimal ranges vary by age and sex: 5.0–7.0 mg/dL for middle-aged men, 4.0–6.0 mg/dL for middle-aged women, and 4.0–5.0 mg/dL for older adults
- Uric acid is a KDM biomarker: It directly feeds into the Klemera-Doubal biological age algorithm — higher levels accelerate your calculated biological age
- Lifestyle levers are powerful: Hydration, Mediterranean diet, fructose/alcohol reduction, body composition, exercise, kidney protection, and inflammation management can collectively shift uric acid by 2-4 mg/dL
Start tracking your uric acid and biological age today
Uric acid is one of those rare biomarkers that tells two stories simultaneously — one about protection, one about destruction. Knowing which story your levels are telling is the first step toward optimizing your healthspan.
Ready to see where you stand? Download SuperAge and use the KDM biological age calculator to see exactly how your uric acid — along with 9 other biomarkers — determines your biological age.
References
- Frontiers in Nutrition (2025). “The impact of serum uric acid on biological aging and mortality risk: insights from the NHANES and CHARLS cohorts.” — Large-scale evidence linking uric acid to biological age acceleration
- Scientific Reports (2025). “Association of uric acid to high-density cholesterol ratio (UHR) with biological age acceleration: evidence from NHANES 2009-2018.” — UHR as a novel predictor of biological aging
- Alvarez-Lario B, Macarron-Vicente J (2010). “Uric acid and evolution.” Rheumatology, 49(11):2010-2015. — Evolutionary loss of uricase and implications for human lifespan
- Ames BN, et al. (1981). “Uric acid provides an antioxidant defense in humans against oxidant- and radical-caused aging and cancer.” PNAS, 78(11):6858-6862. — Foundational study on uric acid’s antioxidant role
- Medical News Today (2023). “Longevity: Levels of creatinine, glucose, and uric acid may be key.” — Centenarian biomarker profiles
- University of Limerick (2019). “Extreme levels of uric acid can significantly reduce patient survival.” — U-shaped mortality curve across 15,000+ patients
- Klemera P, Doubal S (2006). “A new approach to the concept and computation of biological age.” Mechanisms of Ageing and Development, 127(3):240-248. — The KDM biological age algorithm
- Aging (2020). “Uric acid induces stress resistance and extends the life span through activating DAF-16/FOXO and SKN-1/NRF2.” — Molecular mechanisms of uric acid in longevity pathways
- Frontiers in Nutrition (2026). “Association between the uric acid-to-albumin ratio and risk of all-cause mortality in centenarians: a prospective cohort study.” — UAR as a composite biomarker in the oldest-old
- International Journal of Surgery (2026). “Biological aging and gout risk in hyperuricemia: a UK Biobank study.” — Biological age acceleration and hyperuricemia
- Rickard C et al. (2026). “Serum Uric Acid Levels in Older Adults: Associations With Clinical Outcomes and Implications for Reference Intervals in Those Aged 70 Years and Over.” Arthritis Care & Research — Age-specific uric acid reference ranges
- PLoS One (November 2025). “Association of hyperuricemia with coronary heart disease and other cardiovascular outcomes: A systematic review and dose-response meta-analysis.” — 39 studies, >1M participants; per-unit cardiovascular risk increases
- Frontiers in Pharmacology (2025). “Serum uric acid reduction through SGLT2 inhibitors: evidence from a systematic review and meta-analysis.” — 51 RCTs, 54,544 patients; empagliflozin and the SGLT2 class as urate-lowering agents
- FitzGerald JD et al. (2020). “2020 American College of Rheumatology Guideline for the Management of Gout.” Arthritis Care & Research — Treat-to-target urate-lowering therapy for gout, not asymptomatic hyperuricemia alone
The information provided does not replace professional medical advice. Consult your healthcare provider before making changes to your diet, exercise, or medication regimen.
Last updated: 2026-06-26. This article is regularly reviewed to ensure accuracy.
Related Articles
Total cholesterol and longevity: What your number really means for aging
Total cholesterol isn't just about heart disease. Discover the cholesterol paradox, optimal ranges by age for longevity, and how KDM uses it to calculate your biological age.