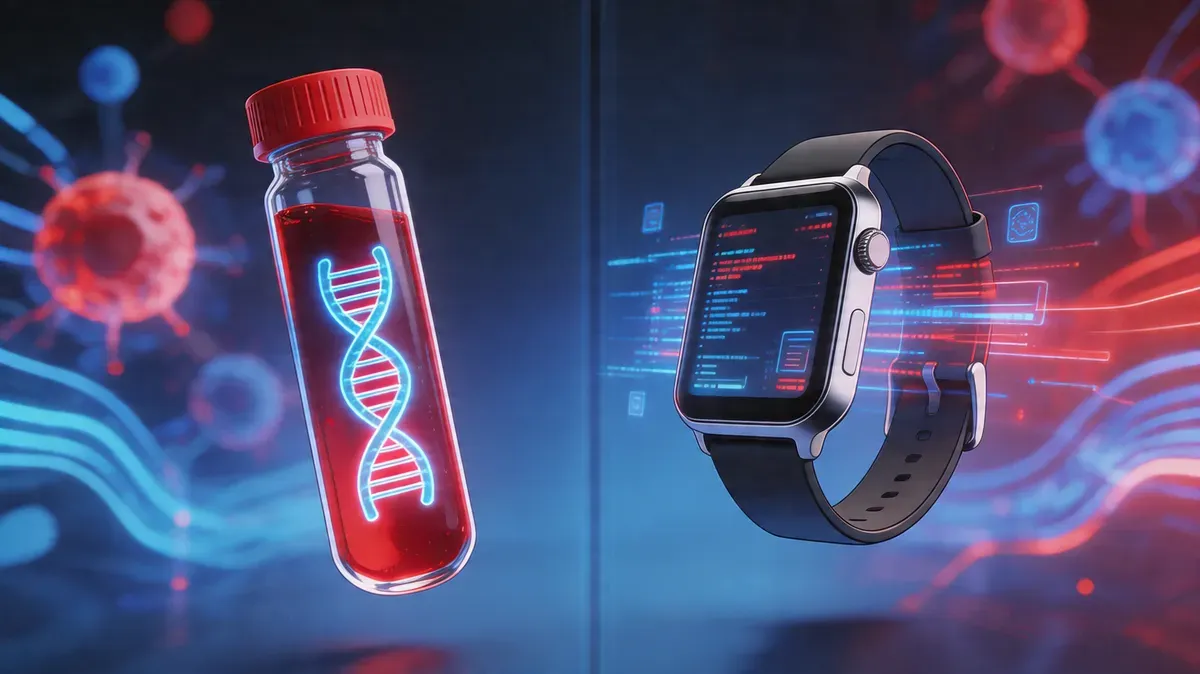
Biological age from blood tests vs wearables: Which is more accurate?
Blood tests vs wearables for biological age compared: accuracy, cost, repeatability, and when each modality is the right choice for longevity tracking.
A blood-based PhenoAge score predicts all-cause mortality with a correlation around r ≈ 0.4 — strong for a single snapshot. A wearable-derived VO2 max estimate predicts mortality in large cohorts with correlations between r ≈ 0.3 and r ≈ 0.5, depending on how it is measured and who is wearing the device. Two very different modalities, two overlapping ranges of predictive power, and a question that keeps coming up in every longevity forum: is a 150 USD lab panel more trustworthy than a 400 USD ring or watch — or the other way around?
The honest answer is that “more accurate” depends on what you are trying to measure, how often you want to measure it, and how much the result is going to change your behavior. Blood biomarkers capture molecular aging over months and years. Wearables capture physiological aging over minutes and days. Neither of them alone is the ground truth, because there is no single ground truth for biological age.
This guide walks through how each modality actually works, what the word “accurate” means for each, where they agree, where they disagree, and how to choose — or combine — them.
What you’ll learn:
- How blood-based and wearable-based biological age are computed under the hood
- What “accuracy” means for each (test-retest, mortality prediction, responsiveness)
- Where blood tests clearly win, where wearables clearly win
- How to combine both without drowning in numbers
Quick answer
Verdict: For predicting mortality risk from a single snapshot, blood-based scores like PhenoAge and KDM are still the reference standard. For tracking how your body responds to training, sleep, and stress week by week, wearables are far superior. If you can only pick one, match it to your goal: blood tests for “how old am I right now?”, wearables for “am I getting better?”. For anyone serious about longevity, the right answer is both — they measure different timescales of the same aging process.
Key facts
- Blood tests measure molecular aging; wearables measure functional and autonomic aging. Different layers, different timescales.
- Blood-based scores (PhenoAge, KDM) still have the best mortality validation from a single snapshot.
- Wearable-derived scores win on test-retest reliability, cadence, cost per data point, and responsiveness to intervention.
- Neither modality alone captures the full picture; they are orthogonal, not redundant.
- For most adults, the right answer is one blood panel every 6–12 months plus a wearable read continuously — combined into a single view.
- The best biological-age measurement is the one you will actually repeat. Pick the cadence you can sustain, then add the second modality when you are ready.
How blood-based biological age works
Blood-based biological age is computed from a small set of clinical biomarkers that, together, capture organ function, inflammation, and metabolic health. Two formulas dominate the literature:
- PhenoAge (Levine 2018): uses 9 markers — albumin, creatinine, glucose, C-reactive protein (CRP), lymphocyte percentage, mean corpuscular volume (MCV), red cell distribution width (RDW), alkaline phosphatase, and white blood cell count — plus chronological age. Output is an age in years.
- Klemera-Doubal Method (KDM): a multivariate regression that projects a panel of markers onto the age axis that best explains them. More flexible in terms of which markers go in.
The markers are not glamorous — there is no epigenetic methylation array, no telomere length. But that is exactly the point. A 2018 Aging study (Levine et al.) showed PhenoAge outperformed chronological age and many more expensive assays for predicting all-cause mortality, cardiovascular disease, and cancer in large cohorts. The PhenoAge and KDM methodology is now used in dozens of longevity studies precisely because the inputs are cheap, standardized, and measured in every clinical lab on the planet.
What these 9 markers actually capture:
- Systemic inflammation (CRP, WBC, lymphocyte %) — the background “noise” of aging
- Metabolic health (glucose) — insulin sensitivity and mitochondrial function
- Kidney and liver load (creatinine, alkaline phosphatase) — filtration capacity
- Red blood cell health (MCV, RDW) — nutritional and oxidative status
- Protein reserves (albumin) — one of the strongest standalone predictors of mortality after age 65
What they do not capture: fitness, VO2 max, sleep architecture, cardiovascular autonomic tone, or how you actually move through a day. A sedentary 45-year-old and an ultramarathoner with the same fasting glucose, albumin, and CRP can get nearly identical PhenoAge scores — even though their functional aging trajectories are wildly different.
Typical cadence: every 3–12 months. Typical cost: 80–250 USD (roughly 75–230 EUR) for the full 9-marker panel, depending on country and whether insurance covers it. The optimal longevity panel and testing frequency is a separate decision tree — but PhenoAge only needs a subset of any standard longevity draw.
How wearable-derived biological age works
Wearable-based biological age is not a single formula. It is a composite of physiological signals that correlate with biological aging, combined into a score using proprietary or published algorithms. The inputs most apps use:
- VO2 max estimate — inferred from heart rate response during walking and running, calibrated against treadmill-test reference data. By far the strongest single predictor of longevity in wearable data.
- Resting heart rate (RHR) — a long-term average, reflecting cardiovascular efficiency and baseline stress.
- Heart rate variability (HRV) — beat-to-beat variation, a proxy for autonomic nervous system balance and recovery capacity.
- Sleep architecture — total sleep, deep sleep, REM, wake after sleep onset (WASO), sleep efficiency.
- Activity volume and intensity — steps, active calories, minutes in moderate-to-vigorous zones.
- Gait and balance signals — step length, walking asymmetry, double support time (on devices that measure them).
These get aggregated into a score that is usually expressed as an “age” in years. Under the hood, it is a weighted regression: VO2 max typically dominates (30–45% of the weight), with cardiovascular, recovery, and body composition signals filling in the rest. The Apple Watch health features for longevity cover this ecosystem in depth.
The accuracy of the underlying sensors matters a lot. Optical heart rate is excellent at rest, reasonable during steady cardio, and mediocre during high-intensity intervals. Sleep staging on wrist-based devices still disagrees with polysomnography on the minute-by-minute level but tracks total sleep and sleep efficiency well. For a detailed breakdown, see our post on Apple Watch health metrics accuracy.
Typical cadence: continuous — roughly 300–500 data points per day. Typical cost: 150–600 USD (roughly 140–560 EUR) for the device, amortized over 2–3 years.
Accuracy, validation, and what “accurate” even means
Before comparing the two modalities, the word “accurate” needs three separate meanings:
- Test-retest reliability. If you run the same test twice under the same conditions, do you get the same number?
- Criterion validity. Does the score correlate with an outcome we care about — usually mortality, disease onset, or functional decline?
- Responsiveness. If you actually change something in your life, does the score move in the right direction within a reasonable time?
These are very different properties, and blood tests and wearables sit at opposite ends of each.
Test-retest reliability
Blood tests drawn one week apart on the same person typically agree within 5–10% for each marker, and PhenoAge scores computed from those draws generally agree within roughly 1–2 years. Pre-analytical factors matter: fasting state, time of day, recent exercise, acute infection, and hydration can all shift markers by more than a year of “PhenoAge” in either direction. CRP is particularly volatile — a cold the week before your draw can push PhenoAge up by 3–5 years.
Wearables have very high test-retest reliability for RHR, HRV, and step count (within a few percent day over day on a stable individual). VO2 max estimates are smoother because they are already multi-day rolling averages. Composite “biological age” scores from wearables typically fluctuate by less than one year month over month once baseline stabilizes.
Verdict: wearables win on short-term reliability. Blood tests are noisier on any single draw but the noise averages out across sessions.
Criterion validity (mortality prediction)
This is where blood tests still hold the edge. In large cohorts (NHANES, UK Biobank), PhenoAge has hazard ratios for all-cause mortality around 1.04–1.05 per year of PhenoAge acceleration — strong, reproducible, and independent of chronological age. KDM performs similarly.
Wearable-derived scores are catching up. VO2 max alone is one of the strongest mortality predictors ever measured in exercise physiology: each 1 MET increase (3.5 mL/kg/min) is associated with a 10–25% lower all-cause mortality risk. HRV and RHR add incremental predictive value. Composite wearable scores in recent studies reach hazard ratios broadly comparable to PhenoAge in middle-aged cohorts.
Verdict: rough tie for mortality prediction in healthy adults, with blood tests still better validated across age groups and comorbidities.
Responsiveness
This is where wearables dominate. Start a structured aerobic program and your VO2 max estimate will start moving within 4–8 weeks. Sleep more consistently and HRV trends follow within 2–4 weeks. Pace-of-aging style metrics — how fast your biological clock is ticking — are easier to detect in high-frequency wearable data than in quarterly blood draws. For the practical retest question, see can biological age change in 90 days?.
Blood biomarkers are slower. CRP can drop within weeks of reducing visceral fat, but HbA1c needs 2–3 months, and albumin or MCV can take 6–12 months to meaningfully shift. PhenoAge responsiveness in intervention trials is real but typically on a 6-month minimum horizon.
Verdict: wearables win decisively on responsiveness.
Head-to-head comparison
| Dimension | Blood-based (PhenoAge/KDM) | Wearables (VO2 max + HRV + RHR + sleep) |
|---|---|---|
| Mortality prediction (single snapshot) | Strong (r ≈ 0.4, HR ≈ 1.04/yr) | Moderate to strong (r ≈ 0.3–0.5) |
| Test-retest reliability | Moderate (5–10% per marker) | High (daily stable ±1–3%) |
| Responsiveness to intervention | Slow (3–12 months) | Fast (2–8 weeks) |
| Cadence | 1–4 times per year | Continuous (24/7) |
| Cost per year | 80–250 USD per panel × 2–4 = 160–1000 USD | Device amortized: 50–200 USD/year |
| Availability | Requires blood draw + lab | Passive, after one-time setup |
| Captures molecular aging | Yes (inflammation, metabolism, organ reserve) | Indirectly |
| Captures functional aging | No | Yes (fitness, autonomic tone, sleep) |
| Affected by acute illness | Strongly (CRP, WBC) | Yes but transparently (HRV, RHR spike visible) |
| Actionable short-term | Limited | High |
| What it misses | Fitness, sleep, daily variability | Deep metabolism, organ reserve, nutrition status |
Notice that almost every row has a trade-off. Blood tests win on snapshot precision of molecular aging. Wearables win on cadence, cost per data point, and responsiveness.
Where blood tests win
There are situations where a blood panel is clearly the better tool:
- You have never been tested. A single baseline PhenoAge draw tells you more about your current mortality risk than a year of wearable data. It is the anchor.
- You suspect metabolic or inflammatory issues. Rising HbA1c, low albumin, high CRP, abnormal liver enzymes — none of these can be detected by a watch. Silent conditions like prediabetes or early kidney decline are caught here first.
- You are over 60. Functional wearable metrics (VO2 max, HRV) become harder to interpret at older ages because of medication effects, lower exercise variability, and confounding conditions. Blood markers remain robust. For biological age benchmarks in your 60s — what a good gap looks like and what drives scores in that decade — see our dedicated guide.
- You are optimizing with specific interventions. Starting omega-3, metformin, rapamycin, HRT, or a GLP-1 agonist? Blood tests are the direct readout.
- You want regulated, clinician-grade data. Lab values are standardized, traceable, and can be reviewed with a physician.
Blood tests also win for one specific type of person: those who will actually repeat them. A PhenoAge done once in 2023 is a curiosity. A PhenoAge done every 6 months for 5 years is a pace-of-aging dataset that no wearable can match for molecular depth.
Where wearables win
- You want feedback loops. Wearables close the gap between action and measurement from months to days. If you want to know whether last night’s sleep was good, today’s HRV will tell you.
- You want to catch illness early. A resting heart rate 5–10 bpm above baseline for 3 consecutive days is one of the earliest detectable signs of infection, often 24–48 hours before symptoms.
- You want to measure fitness directly. VO2 max is the best single predictor of longevity and it is essentially invisible in a standard blood panel.
- You do not like needles or you travel often. Continuous passive measurement with zero logistics beats “book a lab, fast, drive in, pay, wait.”
- You are optimizing training, sleep, or stress. Wearable data is the right resolution for these interventions.
- You are younger than 40 and healthy. Your blood markers are likely all in range and not moving much year over year. Wearable data will show meaningful variation where blood tests will not.
Why combining them is usually the right answer
Blood tests and wearables are not competing measurements of the same thing. They are orthogonal signals from different layers of biology, on different timescales:
- Wearables — behavioral and autonomic layer, minutes to weeks
- Blood biomarkers — molecular and metabolic layer, weeks to months
- Clinical events and epigenetic clocks (when available) — structural layer, months to years
The three layers move at different speeds and in partially independent directions. That is why combining them adds information rather than just redundancy. A common real-world pattern:
- Your wearable VO2 max is excellent (fitness age 35, chronological 45), but your fasting glucose is 108 mg/dL (6.0 mmol/L) and CRP is 3.2 mg/L. You are metabolically older than you are cardiovascularly. Training volume is not your problem; diet and body composition probably are.
Or the opposite:
- Your blood panel is immaculate (PhenoAge = chronological age − 3 years), but your HRV trend has been declining for 6 weeks and your sleep efficiency is at 78%. Your molecular age is holding, but your nervous system is telling you something is coming.
Neither modality alone would catch these patterns. A proper personal health dashboard that combines wearables, blood tests, and lifestyle data is the practical way to keep both visible at the same time.
How SuperAge bridges both
SuperAge is designed around the premise that neither blood tests nor wearables alone are enough. The app computes a single biological age that accepts both inputs:
- HealthKit data from your Apple Watch and iPhone — VO2 max, HRV, RHR, sleep stages, activity minutes, steps, gait metrics. Read continuously, passively, in the background.
- Blood test inputs — you can enter PhenoAge/KDM panel markers (albumin, creatinine, glucose, CRP, lymphocyte %, MCV, RDW, alkaline phosphatase, WBC) alongside standard longevity markers.
The score is one number, but the contributions are transparent — you can see how much of your biological age is coming from cardiovascular fitness, body composition, recovery, lifestyle, and blood markers. The full weighting is documented in how biological age is calculated in SuperAge.
What this gives you in practice:
- When you get new lab results, your biological age updates. You can see the effect of the intervention on the molecular layer.
- Between lab draws, your wearable data keeps the score alive. A training cycle that improves VO2 max shows up within weeks.
- The trend over time is the real signal — not any single reading. Six to twelve months of combined data tells you whether you are aging slower, faster, or at chronological pace.
This is the “combine the modalities” approach, operationalized, without requiring you to maintain a spreadsheet.
If you are choosing a remote or at-home panel rather than a clinician-ordered draw, use this home biomarker test comparison checklist to screen lab quality, sample type, repeatability, and privacy before buying.
Frequently asked questions
Is a blood test really more accurate than a wearable?
For mortality prediction from a single snapshot, yes — blood-based scores like PhenoAge are the most validated. For tracking change in response to your lifestyle, no — wearables have tighter cadence and faster responsiveness. “More accurate” depends on the question.
How often should I repeat each?
Blood panel for biological age: every 6–12 months for most adults, every 3–6 months during an active intervention. Wearable data: continuously — the work is already done. Review wearable trends weekly or monthly, not daily.
Can acute illness mess up my PhenoAge?
Yes, significantly. A cold, flu, recent vaccination, or an intense workout in the 48 hours before your draw can inflate CRP and WBC and push PhenoAge up by 3–5 years. Always draw when you have been healthy and rested for at least 5–7 days.
Do epigenetic clocks beat both?
Epigenetic clocks like GrimAge V2 and DunedinPACE have excellent validation, but they cost 300–500 USD per draw and cannot be repeated frequently. For most people, a PhenoAge-style panel plus a wearable is 80% of the signal at 20% of the cost. See epigenetic clocks explained for the full comparison.
What if my blood-based age and wearable-based age disagree by 10 years?
Common and informative. The usual pattern is “fit but metabolically stressed” (wearable younger, blood older) or “healthy panel but deconditioned” (blood younger, wearable older). Both scenarios have specific intervention paths — see the combine section above. A similar divergence often appears when comparing biological age vs metabolic age: a smart scale’s metabolic age tracks body composition and BMR, not the biomarker-calibrated signals that predict mortality.
Key takeaways
- Blood tests measure molecular aging; wearables measure functional and autonomic aging. Different layers, different timescales.
- Blood-based scores (PhenoAge, KDM) still have the best mortality validation from a single snapshot.
- Wearable-derived scores win on test-retest reliability, cadence, cost per data point, and responsiveness to intervention.
- Neither modality alone captures the full picture; they are orthogonal, not redundant.
- For most adults, the right answer is one blood panel every 6–12 months plus a wearable read continuously — combined into a single view.
- The best biological-age measurement is the one you will actually repeat. Pick the cadence you can sustain, then add the second modality when you are ready.
Start with the measurement you’ll actually repeat
Whether you are starting from a blood panel or from a year of Apple Watch data, the goal is the same: one biological age number that updates when either input changes, tracked over time. You can download SuperAge on the App Store and connect HealthKit in under two minutes. Add your blood results when you have them. The combined score starts building a trend from day one.
References
- Levine ME, Lu AT, Quach A, et al. An epigenetic biomarker of aging for lifespan and healthspan. Aging (Albany NY). 2018;10(4):573-591. PhenoAge derivation and validation.
- Klemera P, Doubal S. A new approach to the concept and computation of biological age. Mech Ageing Dev. 2006;127(3):240-248. The KDM methodology.
- Ross R, Blair SN, Arena R, et al. Importance of Assessing Cardiorespiratory Fitness in Clinical Practice. Circulation. 2016;134(24):e653-e699. AHA scientific statement on VO2 max and mortality.
- Jensen MT, Suadicani P, Hein HO, Gyntelberg F. Elevated resting heart rate, physical fitness and all-cause mortality. Heart. 2013;99(12):882-887. RHR and mortality in long-term follow-up.
- Liu Z, Kuo PL, Horvath S, Crimmins E, Ferrucci L, Levine M. A new aging measure captures morbidity and mortality risk across diverse subpopulations. PLoS Med. 2018;15(12):e1002718. PhenoAge generalizability.
This article is for educational purposes only and is not medical advice. Biological age scores — from blood tests, wearables, or both — are tools for tracking trends, not diagnostic instruments. Talk to your physician before making changes based on any single measurement.
Related Articles

Training readiness vs HRV trend: which should guide workouts?
Training readiness vs HRV trend explained: when to trust a recovery score, when to check your baseline, and how to adjust workouts safely without overreacting.