Lymphocyte %: Your immune system's thermometer (and why it predicts how fast you're aging)
Lymphocyte % is one of the 9 PhenoAge biomarkers for calculating biological age. Discover optimal values, what high and low lymphocytes mean, and how to optimize your immune system for longevity.
Open your blood test results. Scroll down to the complete blood count section. There’s probably a line that says “Lymphocyte %” followed by a number — and you’ve probably never looked at it twice.
Yet that number is one of the 9 biomarkers used by PhenoAge, the most validated scientific algorithm for calculating biological age. Not cholesterol. Not glucose. Your lymphocyte percentage — the silent thermometer of your immune system.
A study of 31,178 adults in JAMA Network Open found that low absolute lymphocyte counts predicted higher mortality risk even after adjustment for age and sex. Compared with adults above 1,500 lymphocytes/µL, mild lymphopenia had an adjusted hazard ratio of 1.3, while severe lymphopenia had an adjusted hazard ratio of 1.8. And the most disturbing part? Immune aging begins much earlier than you think.
In this article, you’ll discover what lymphocyte % actually means, why it’s so important for aging, and what you can do to maintain it in optimal ranges.
For a lab-report reference page with ranges, aliases, and SuperAge context, see the lymphocyte percentage biomarker guide.
What you’ll learn:
- What lymphocyte % is and why it differs from absolute count
- Normal ranges and optimal ranges for longevity
- What high and low lymphocytes mean (and when to worry)
- How immunosenescence erodes your defenses with age
- 7 evidence-based strategies to optimize your lymphocytes
What Are Lymphocytes?
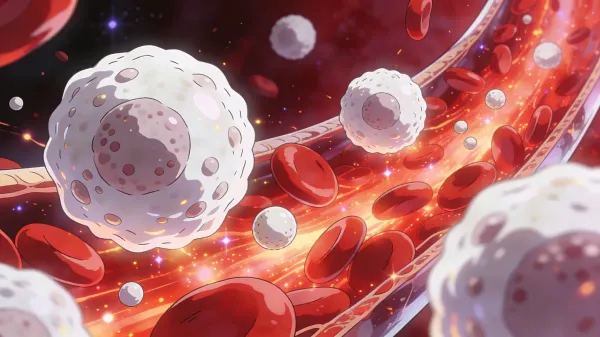
Lymphocytes are a type of white blood cell (leukocyte) that forms the backbone of your adaptive immune system — the one that learns, remembers, and fights specific threats.
Quick definition: Lymphocyte % indicates the percentage of lymphocytes relative to total white blood cells in your blood. In a healthy adult, they represent between 20% and 40% of total leukocytes.
There are three main types of lymphocytes, each with a specific role:
| Type | Primary Function | Typical Percentage |
|---|---|---|
| T Lymphocytes | Attack infected and tumor cells, coordinate immune response | 60-70% of total lymphocytes |
| B Lymphocytes | Produce antibodies against specific pathogens | 10-20% of total lymphocytes |
| NK Cells (Natural Killer) | Destroy abnormal cells without needing prior “instructions” | 5-10% of total lymphocytes |
Percentage vs Absolute Count: What’s the Difference?
When you read your blood count, you’ll find two entries for lymphocytes:
- Lymphocyte % (relative value): the proportion relative to total white blood cells
- Absolute Lymphocytes (absolute value): the actual number of lymphocytes per microliter of blood
Both are important, but they tell different stories. The percentage can be misleading if total white blood cells are abnormal. For example, if neutrophils (another type of white blood cell) drop drastically, the lymphocyte percentage rises even if their actual number hasn’t changed.
This is why doctors always evaluate both values together. And for PhenoAge calculation, the value used is precisely the lymphocyte %.
Normal and Optimal Lymphocyte % Values
Standard Clinical Ranges
| Parameter | Normal Range | Unit |
|---|---|---|
| Lymphocyte % | 20-40% | % of total leukocytes |
| Absolute Lymphocytes | 1,000-4,800 | cells/µL |
| Lymphopenia Threshold | < 1,000-1,500 | cells/µL |
| Lymphocytosis Threshold | > 4,000-4,800 | cells/µL |
Ranges by Age
| Age Group | Typical Lymphocyte % | Absolute Lymphocytes |
|---|---|---|
| Newborns (0-1 year) | 40-70% | 2,000-11,000/µL |
| Children (1-6 years) | 35-55% | 1,500-7,000/µL |
| Adolescents (7-17 years) | 25-45% | 1,000-5,500/µL |
| Adults (18-64 years) | 20-40% | 1,000-4,800/µL |
| Over 65 | 20-35% | 1,000-3,500/µL |
Important note: Children have physiologically higher lymphocyte percentages than adults. A value of 50% in a 3-year-old child is perfectly normal.
The Optimal Range for Longevity
Here’s where it gets interesting. The clinical “normal” range (20-40%) is very broad. But longevity research suggests a narrower optimal range:
- Optimal PhenoAge Range: 25-35%
- Aging Warning Signal: below 20%
- Centenarian Sweet Spot: centenarians tend to maintain stable, functional lymphocyte percentages with a surprisingly preserved immune profile
An NIH study on immune profiles of extremely long-lived individuals revealed that centenarians maintain normal total lymphocyte counts, albeit with a particular distribution: fewer T helper cells (CD4+) but greater overall immune system efficiency.
High Lymphocytes (Lymphocytosis): Causes and Meaning
Lymphocytosis occurs when lymphocytes exceed 40% or 4,800 cells/µL. In most cases, it’s a temporary and benign reaction.
Common Causes
Temporary (most frequent):
- Viral infections (flu, mononucleosis, COVID-19, hepatitis)
- Acute bacterial infections
- Allergic reactions
- Intense physical stress (post-surgery, trauma)
Chronic (requires investigation):
- Autoimmune diseases (rheumatoid arthritis, lupus)
- Chronic infections (tuberculosis, toxoplasmosis)
- Chronic lymphocytic leukemia (CLL) — especially in people over 60
- Lymphomas
When to Worry
In most cases, slightly elevated lymphocytes after flu or infection are normal and temporary. You should investigate further if:
- Lymphocytosis persists for more than 2-3 weeks without apparent cause
- Lymphocytes exceed 10,000/µL in absolute value
- You have associated symptoms: unexplained weight loss, night sweats, chronic fatigue, enlarged lymph nodes
- You’re over 60 with persistent lymphocytosis (rule out CLL)
Rule of thumb: Isolated lymphocytosis after infection typically resolves within 2-4 weeks. If it persists, talk to your doctor.
Low Lymphocytes (Lymphopenia): Causes and Risks
Lymphopenia — usually defined in adults as an absolute lymphocyte count below 1,000 cells/µL, with 1,000-1,500 cells/µL often treated as a low or borderline zone depending on the lab — is often more concerning than lymphocytosis, especially from a longevity perspective. A low percentage alone should still be interpreted with the absolute count and the rest of the CBC.
Common Causes
Medications and treatments:
- Corticosteroids (cortisone lowers lymphocytes within hours)
- Chemotherapy and radiation therapy
- Immunosuppressants (post-transplant)
Medical conditions:
- Severe acute infections (sepsis, HIV/AIDS)
- Autoimmune diseases (lupus, where the body attacks its own lymphocytes)
- Malnutrition and zinc/vitamin D deficiencies
- Chronic kidney failure
Age-related causes:
- Thymic involution (the organ that “trains” T lymphocytes)
- Low-grade chronic inflammation (inflammaging)
- Depletion of naive T cell pool
The Data That Should Concern You
A JAMA Network Open analysis of 31,178 US adults demonstrated that lymphopenia is an independent predictor of all-cause mortality. The association was strongest at lower absolute lymphocyte counts and persisted after adjustment for age and sex.
In numbers: compared with adults above 1,500 lymphocytes/µL, mild lymphopenia (1,100-1,500/µL) carried an adjusted hazard ratio of 1.3, and severe lymphopenia (≤1,000/µL) carried an adjusted hazard ratio of 1.8. The unadjusted signal was particularly visible for:
- Cardiovascular mortality
- Cancer mortality
- Infection mortality
Lymphocytes, Aging, and Longevity
Here’s the heart of the article — and why lymphocyte % is much more than a number in your blood count.
Immunosenescence: When the Immune System Ages
The term immunosenescence describes the progressive deterioration of the immune system with age. It’s not a disease: it’s a natural process that begins much earlier than you think.
What happens to your lymphocytes with age:
-
The thymus atrophies. This organ (behind the sternum) produces “new” (naive) T lymphocytes. After puberty, the thymus begins to shrink. By age 50, it has lost about 80-90% of its functionality.
-
Naive T cells decline. Without the thymus, the body produces fewer and fewer “virgin” T lymphocytes capable of recognizing new threats.
-
Memory T cells accumulate. The system fills with “aged” lymphocytes specialized against past threats but unable to adapt to new ones.
-
The CD4/CD8 ratio inverts. Normally, the ratio between T helper cells (CD4) and cytotoxic T cells (CD8) is greater than 1. With age, this ratio tends to drop below 1 — a signal of accelerated immune aging.
Why Thymic Health Matters More Than We Thought (Harvard, 2026)
For decades, the prevailing view was that the thymus becomes largely irrelevant after puberty. Two studies published in Nature in March 2026 by Harvard-affiliated researchers at Brigham and Women’s Hospital and Dana-Farber Cancer Institute overturn that assumption.
By scoring thymic health on chest CT scans in tens of thousands of adults, the researchers showed that adults with the best-preserved thymic tissue had:
- ~50% lower all-cause mortality compared with those with the lowest thymic health scores
- ~63% lower cardiovascular mortality
- ~36% lower risk of developing lung cancer
- Among cancer patients receiving immunotherapy: ~37% lower risk of progression and ~44% lower risk of cancer death
In other words: how well your thymus has aged is one of the strongest single predictors of how long, and how well, you will live. This is the biological “factory” behind your lymphocyte percentage — and it remains consequential decades after it was assumed to be dormant.
A 2025 Study in Nature Quantified This Decline
Research published in Nature in 2025 analyzed over 300 healthy adults aged 25 to 90 using single-cell RNA sequencing, proteomics, and flow cytometry. The results showed that:
- The transcriptional reprogramming of T cell subtypes is not linear, and age-related immune shifts begin before advanced age
- The dataset captured more than 16 million peripheral blood mononuclear cells across 71 immune cell subsets
- The T cell changes were not simply driven by systemic inflammation or chronic cytomegalovirus infection, making immune aging more specific than a generic “inflammation goes up” story
The Immune Profile of Centenarians
NIH research on extremely long-lived individuals revealed surprising data:
- Centenarians maintain normal total lymphocyte counts
- They have higher percentages of B cells than average (preserved antibody production)
- T helper cells (CD4+) are significantly reduced — yet the system functions
- The key isn’t the number of lymphocytes but their functional efficiency
This suggests that it’s not enough to look at the percentage: the quality of immune response matters as much as quantity. A 2026 paper in Science Immunology added a mechanistic twist: B cells aren’t bystanders to immune aging — they actively drive CD4 T cell senescence through cell-to-cell signaling. That helps explain why centenarians’ “lean and cytotoxic” immune phenotype — fewer helper T cells, more capable effector cells — is associated with a longer healthspan.
The Neutrophil-to-Lymphocyte Ratio (NLR): An Emerging Indicator
An increasingly studied parameter is the NLR (Neutrophil-to-Lymphocyte Ratio): the ratio between neutrophils and lymphocytes.
- Optimal NLR: 1-3
- NLR > 3: signal of chronic inflammation and accelerated aging
- NLR > 6: associated with unfavorable prognosis in many conditions
In 2024, scientific publications on NLR reached 1,857, compared to fewer than 50 in 2010 — demonstrating how much this biomarker is gaining relevance in longevity medicine. A 2025 narrative review in Experimental Gerontology synthesized the field and confirmed two practical points: NLR rises predictably with age in the general population, but centenarians show a markedly slower age-related increase in NLR than non-centenarians — a fingerprint of preserved immune balance. The same review highlighted physical activity, dietary patterns, and selected pharmacological interventions (notably metformin) as the most studied levers to keep NLR low.
7 Evidence-Based Strategies to Optimize Lymphocytes
1. Get Enough Vitamin D
Why it works: Vitamin D is a key immune system modulator. It activates VDR receptors present on nearly all T and B lymphocytes, directly influencing their response capacity.
How to do it:
- Sun exposure: 15-20 minutes daily on arms and face (without protection, during safe hours)
- Supplementation: 1,000-4,000 IU/day, based on your blood levels
- Blood target: 40-60 ng/mL (100-150 nmol/L) — the optimal range for immunity
Expected results: Studies show improvement in lymphocyte count within 8-12 weeks of supplementation in deficient subjects.
2. Optimize Zinc Intake
Why it works: Zinc is essential for T lymphocyte development and maturation in the thymus. Even subclinical deficiency accelerates thymic involution and reduces naive T cell production. Zinc and immune aging are deeply linked — roughly 40% of adults over 60 don’t get enough, making it one of the most prevalent and underdiagnosed causes of lymphocyte decline.
How to do it:
- Food sources: oysters, red meat, pumpkin seeds, lentils, chickpeas
- Supplementation (if deficient): 15-30 mg/day of zinc picolinate or gluconate
- Caution: don’t exceed 40 mg/day to avoid interference with copper absorption
3. Exercise Moderately
Why it works: Moderate exercise stimulates lymphocyte circulation, improves immune surveillance, and reduces chronic inflammation. But beware: excess has the opposite effect.
How to do it:
- Optimal exercise: 150-300 minutes/week of moderate activity (brisk walking at 3-3.7 mph / 5-6 km/h, light cycling, swimming)
- Strength training: 2-3 sessions/week (preserves muscle mass, which is a glutamine reservoir for lymphocytes)
- Avoid: prolonged exhausting sessions (marathons, ultra-endurance) without adequate recovery — can temporarily lower lymphocytes for 3-72 hours (“open window” immune period)
Expected results: Improvement in immune function visible in blood tests after 8-12 weeks of regular activity.
4. Sleep 7-9 Hours Per Night
Why it works: During deep sleep, the body produces cytokines and T lymphocytes increase their ability to adhere to infected cells. Even one night of insufficient sleep reduces NK cells by 70%.
How to do it:
- Maintain a regular sleep/wake schedule (even on weekends)
- Room temperature: 64-68°F (18-20°C)
- Avoid bright screens 60 minutes before bed
- Limit caffeine after 2:00 PM
5. Manage Chronic Stress
Why it works: Chronic cortisol is one of lymphocytes’ most powerful enemies. Prolonged stress causes lymphocyte redistribution from blood to tissues, lowering circulating counts, and accelerates immune aging.
How to do it:
- Meditation or diaphragmatic breathing: 10-15 minutes/day
- Nature activities: walking in natural environments reduces cortisol by 12-16% (Japanese “forest bathing” study)
- HRV (heart rate variability): monitor it as an objective stress indicator — chronically low HRV correlates with low lymphocytes
6. Follow an Anti-Inflammatory Diet
Why it works: Low-grade chronic inflammation (inflammaging) progressively depletes the lymphocyte pool. An anti-inflammatory diet protects lymphocytes from oxidative damage and supports their production.
Key foods:
- Omega-3: salmon, mackerel, sardines, walnuts (2-3 fish servings/week)
- Polyphenols: berries, green tea, dark chocolate, extra virgin olive oil
- Probiotics: yogurt, kefir, kimchi, sauerkraut (70% of the immune system resides in the gut)
- Adequate protein: 1.2-1.6 g/kg body weight per day to support antibody production
Limit: refined sugars, excessive alcohol (> 2 units/day), trans fats, ultra-processed foods.
7. Maintain a Healthy Body Weight
Why it works: Excess adipose tissue isn’t a passive depot: it’s an endocrine organ that produces pro-inflammatory cytokines (TNF-α, IL-6), the same ones that accelerate immunosenescence.
How to do it:
- BMI goal: 18.5-24.9 kg/m²
- Waist circumference goal: < 37 in (94 cm) for men, < 31.5 in (80 cm) for women
- Even modest weight loss (5-10% of weight) significantly improves immune parameters
Advanced tip: The CD4/CD8 ratio is a more sensitive indicator of immune aging than simple lymphocyte percentage. If your doctor is willing, request lymphocyte phenotyping in your next blood test. A ratio > 1.0 is reassuring; a ratio < 1.0 suggests accelerated immune aging.
How to Monitor Lymphocytes Over Time
Which Tests to Request
| Test | What It Measures | Recommended Frequency |
|---|---|---|
| Complete Blood Count with Differential | Lymphocyte %, absolute value, WBC, neutrophils | Every 6-12 months |
| Lymphocyte Phenotyping | CD4, CD8, CD4/CD8, NK, B cells | Annual (especially after 50) |
| C-Reactive Protein (hs-CRP) | Systemic inflammation | Every 6-12 months |
| NLR (calculable from blood count) | Neutrophil-to-lymphocyte ratio | With every blood count |
How to Read Results
Don’t look at a single isolated value. The trend over time is much more important than today’s number. A progressive decline in lymphocyte percentage over 2-3 years is a more significant signal than a single low reading.
Three-point rule: always compare at least 3 consecutive values (spaced 6-12 months apart) before drawing conclusions.
How SuperAge Helps You Monitor Lymphocytes
Manually monitoring blood biomarkers and their trends over time is complicated. Spreadsheets, reports scattered in different drawers, numbers difficult to interpret alone. This is where SuperAge makes a difference.
Blood Test Entry
SuperAge lets you manually enter blood test results directly in the app. Or you can use the AI Extractor: take a photo or upload the PDF of your report, and artificial intelligence automatically extracts values — including lymphocyte %.
Automatic PhenoAge Calculation
Lymphocyte percentage is one of the 9 biomarkers used by the PhenoAge algorithm to estimate your biological age. Once you enter the data, SuperAge automatically calculates your PhenoAge and shows you how your immune system — and your body overall — is aging compared to your chronological age.
Trends and Personalized Insights
Each time you add new tests, SuperAge updates your timeline and shows you:
- The trend of your lymphocyte % over time
- Comparison with optimal ranges for longevity (not just clinical ranges)
- The impact of your lymphocytes on overall biological age
The combination of blood data and Apple Watch data (HRV, VO2 max, sleep, activity) offers the most complete picture possible of your biological aging.
Frequently Asked Questions
What’s a good lymphocyte % value for an adult?
The normal clinical range is 20-40%, but to optimize longevity the ideal range is 25-35%. Values below 20% in a healthy adult deserve investigation, even if technically still in the “low-normal” range.
High lymphocytes after infection: should I worry?
No, in most cases. After a viral infection (flu, COVID-19, mononucleosis), it’s normal for lymphocytes to rise for 2-4 weeks. It’s the immune system working. Worry only if lymphocytosis persists beyond 4-6 weeks without apparent cause.
Do lymphocytes naturally decrease with age?
Yes. The decline begins after puberty due to thymic involution but becomes more evident after age 50-60. However, centenarians demonstrate that it’s possible to maintain effective lymphocyte function even at advanced ages — it depends greatly on lifestyle.
What’s the difference between lymphocyte % and absolute lymphocytes?
The percentage indicates the proportion of lymphocytes relative to total white blood cells. The absolute value indicates the actual number of lymphocytes per microliter of blood. A complete evaluation requires both, because the percentage can be misleading if total leukocytes are abnormal.
How can I naturally increase low lymphocytes?
The most effective strategies are: supplement vitamin D and zinc (if deficient), sleep 7-9 hours, do regular moderate exercise, manage chronic stress, and follow an anti-inflammatory diet rich in omega-3, probiotics, and adequate protein. Results are visible in tests after 8-12 weeks.
Is the CD4/CD8 ratio more important than lymphocyte %?
They’re complementary. Lymphocyte % gives you an overview, while the CD4/CD8 ratio is a more specific indicator of immune aging. A CD4/CD8 ratio below 1.0 is associated with increased mortality risk in the elderly. If possible, monitor both.
How often should I check lymphocytes?
For most healthy adults, a complete blood count with differential every 6-12 months is sufficient. After age 50, it’s useful to add lymphocyte phenotyping (CD4, CD8, NK) at least once a year to monitor immunosenescence.
Is lymphocyte % included in biological age calculation?
Yes. PhenoAge — one of the most validated algorithms for calculating biological age — uses lymphocyte % as one of its 9 biomarkers, along with albumin, creatinine, glucose, CRP, MCV, RDW, alkaline phosphatase, and total white blood cells.
Key Takeaways
- Lymphocyte % is one of the 9 PhenoAge biomarkers, the most validated algorithm for calculating biological age from blood
- The optimal range for longevity is 25-35%, not simply “within normal” (20-40%)
- Lymphopenia is an independent predictor of mortality: in a 31,178-adult NHANES analysis, mild lymphopenia had an adjusted hazard ratio of 1.3 and severe lymphopenia 1.8
- Immunosenescence begins earlier than you think: the thymus loses 80-90% of functionality by age 50
- Thymic health is one of the strongest single predictors of longevity: a 2026 Harvard Nature study links better-preserved thymic tissue to ~50% lower all-cause mortality
- Centenarians don’t have more lymphocytes than others, but more efficient lymphocytes — quality matters more than quantity
- The neutrophil-to-lymphocyte ratio (NLR) is an emerging indicator of chronic inflammation and aging
- You can take concrete action: vitamin D, zinc, moderate exercise, sleep, stress management, and anti-inflammatory diet
Start Monitoring Your Lymphocytes Today
Your immune system is aging — the question is: how fast?
Most people discover an immune problem only when they get sick. But with a simple blood count done regularly and the right interpretation, you can intercept the decline years before it becomes a clinical problem.
Lymphocyte % is one of the 9 pillars of your biological age. Monitoring, understanding, and optimizing them is one of the smartest investments you can make for your long-term health.
Want to know how your lymphocytes — and your whole body — are aging? Download SuperAge and start tracking your biological age from your blood tests.
Scientific References
- Association of Lymphopenia With Risk of Mortality Among Adults in the US General Population — JAMA Network Open / PMC — NHANES analysis of 31,178 adults demonstrating lymphopenia as an independent predictor of mortality
- Targeting immunosenescence and inflammaging — Nature (2025) — Comprehensive review of immunosenescence mechanisms
- Thymus may be critical to adult health — Harvard Gazette (2026) — Two Nature studies linking thymic health to ~50% lower mortality and major reductions in cardiovascular and cancer risk
- Immune system profiles of extremely long-lived people — NIH — Unique immune profiles of centenarians
- Multi-omic profiling reveals age-related immune dynamics — Nature (2025) — Study of 300+ adults with single-cell RNA sequencing
- Neutrophil-to-lymphocyte ratio in aging: trends and clinical implications — Experimental Gerontology (2025) — Centenarians show a slower age-related increase in NLR
- B cells drive CD4 T cell immunosenescence and age-associated health decline — Science Immunology (2026) — B cells actively drive helper T cell aging
- Neutrophil-to-Lymphocyte Ratio as aging biomarker — Exploration Publishing (2024) — NLR as an emerging aging indicator
- Immune function parameters as longevity predictors — Aging Journal — Immune parameters as longevity predictors
- ISS Salute — Tipizzazione linfocitaria — Italian National Institute of Health, guide to lymphocyte phenotyping
- Cleveland Clinic — Lymphocytes — Comprehensive guide to lymphocytes
Last updated: June 2026. This article is periodically reviewed for scientific accuracy.
Related Articles
Creatinine: What your kidneys can reveal about longevity
Creatinine links kidney filtration, muscle mass, and biological age. Learn how to read eGFR, cystatin C, UACR, trends, and longevity context.